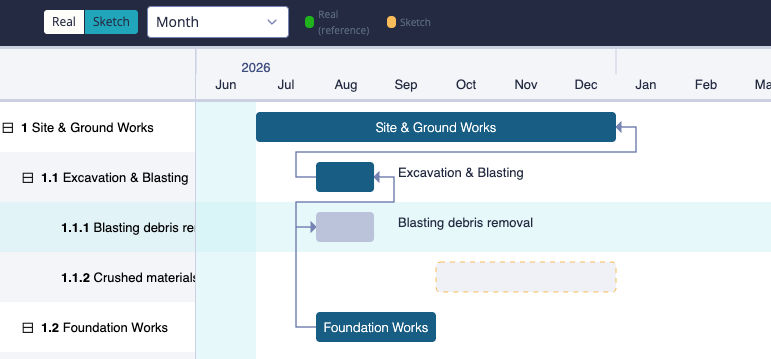
The Gantt chart shows your project activities as a traditional timeline — each activity is a bar spanning its planned dates. Mestamaster’s Gantt has a unique dual-timeline feature: a Real track showing actual execution dates and a Sketch track for planning and what-if scenarios.
Getting there
Open a project → Gantt
Real vs. Sketch mode
The toolbar has a toggle that switches between two modes:
| Mode | Color | Description |
|---|---|---|
| Real | Green | Shows actual task dates from the schedule. Read-only. |
| Sketch | Amber | A planning scratchpad. Bars are editable — drag them, create dependencies, model scenarios. |
In both modes you see two bars per activity: the active mode’s bar and a lighter reference bar from the other mode. This lets you compare planned vs. actual without switching back and forth.
Time granularity
Use the toolbar to change the time scale:
- Hour — detailed view for short tasks
- Day — standard daily view
- Week — good for multi-month projects
- Month — overview for large projects
Working in Sketch mode
Sketch mode is where planning happens. Switch to Sketch (amber) to:
Drag bars
Click and drag an activity bar left or right to change its planned dates.
Create a first estimate
If an activity has no sketch dates yet, drag from an empty row to draw the bar from scratch.
Create dependencies
Click and drag from the end of one activity to the start of another to create a finish-to-start dependency. A connecting arrow appears.
Dependencies propagate automatically — if you move an activity, dependent activities move with it.
Delete a dependency
Double-click the connecting arrow between two activities.
Critical path
Activities on the critical path are highlighted in red. These are the activities that — if delayed — would directly delay the project’s end date. Focus risk management efforts here.
Synthetic activity rows
Some rows are shown in italics with a ↳ prefix. These are rollup rows that summarize the dates of their child activities. They are read-only and update automatically as children change.
Tips
- Use Sketch mode for planning conversations with stakeholders — it’s a safe scratchpad that doesn’t affect the real schedule.
- The Gantt is complementary to the takt Schedule, not a replacement. The Schedule shows spatial flow (which area, which takt); the Gantt shows timeline flow (which activity, which dates).
- Check the critical path before major milestones — a delay in any red activity directly impacts handover.